Pilot phase in Stockholm
Know your numbers. Skip the spreadsheet.
Kai reads your existing sales and financial data and turns it into a clear, always-current picture, plus weekly, monthly and yearly reports, automatically. No more building reports by hand.
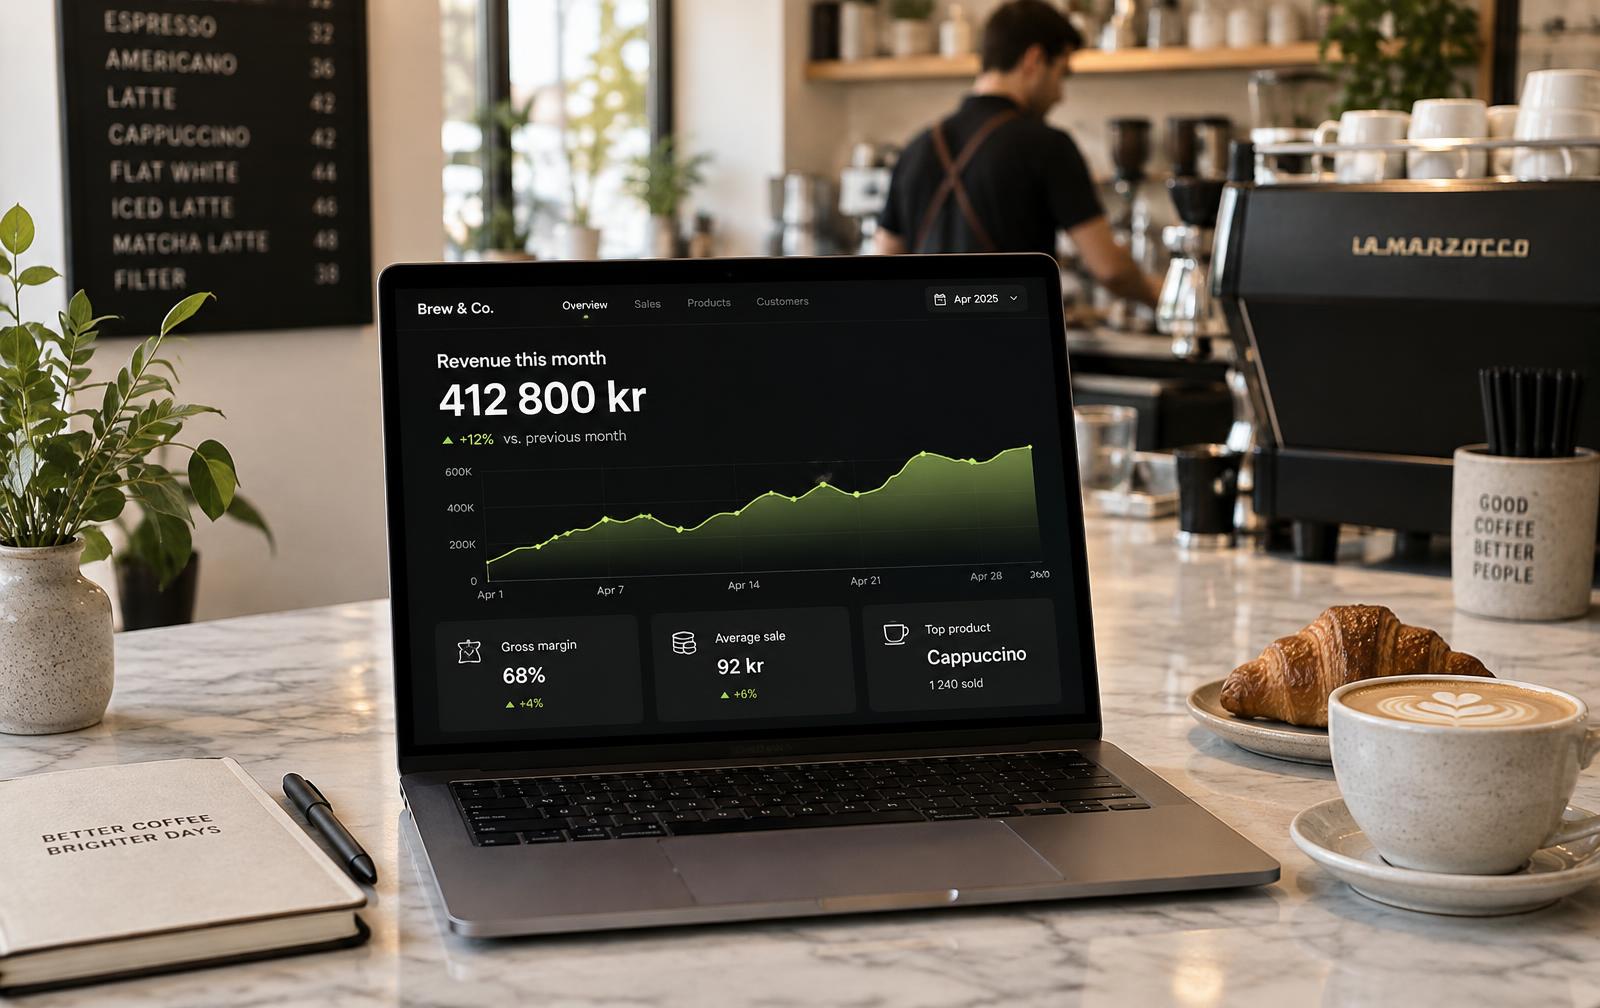
412 800 kr
revenue this month
Revenue vs last month
+9.6%
Margin
68.4%
Top product
Oat flat white
Revenue is 9.6% ahead of last month with margin holding at 68.4%.
INSIDE THE PRODUCT
One financial overview. Every report, automatic.
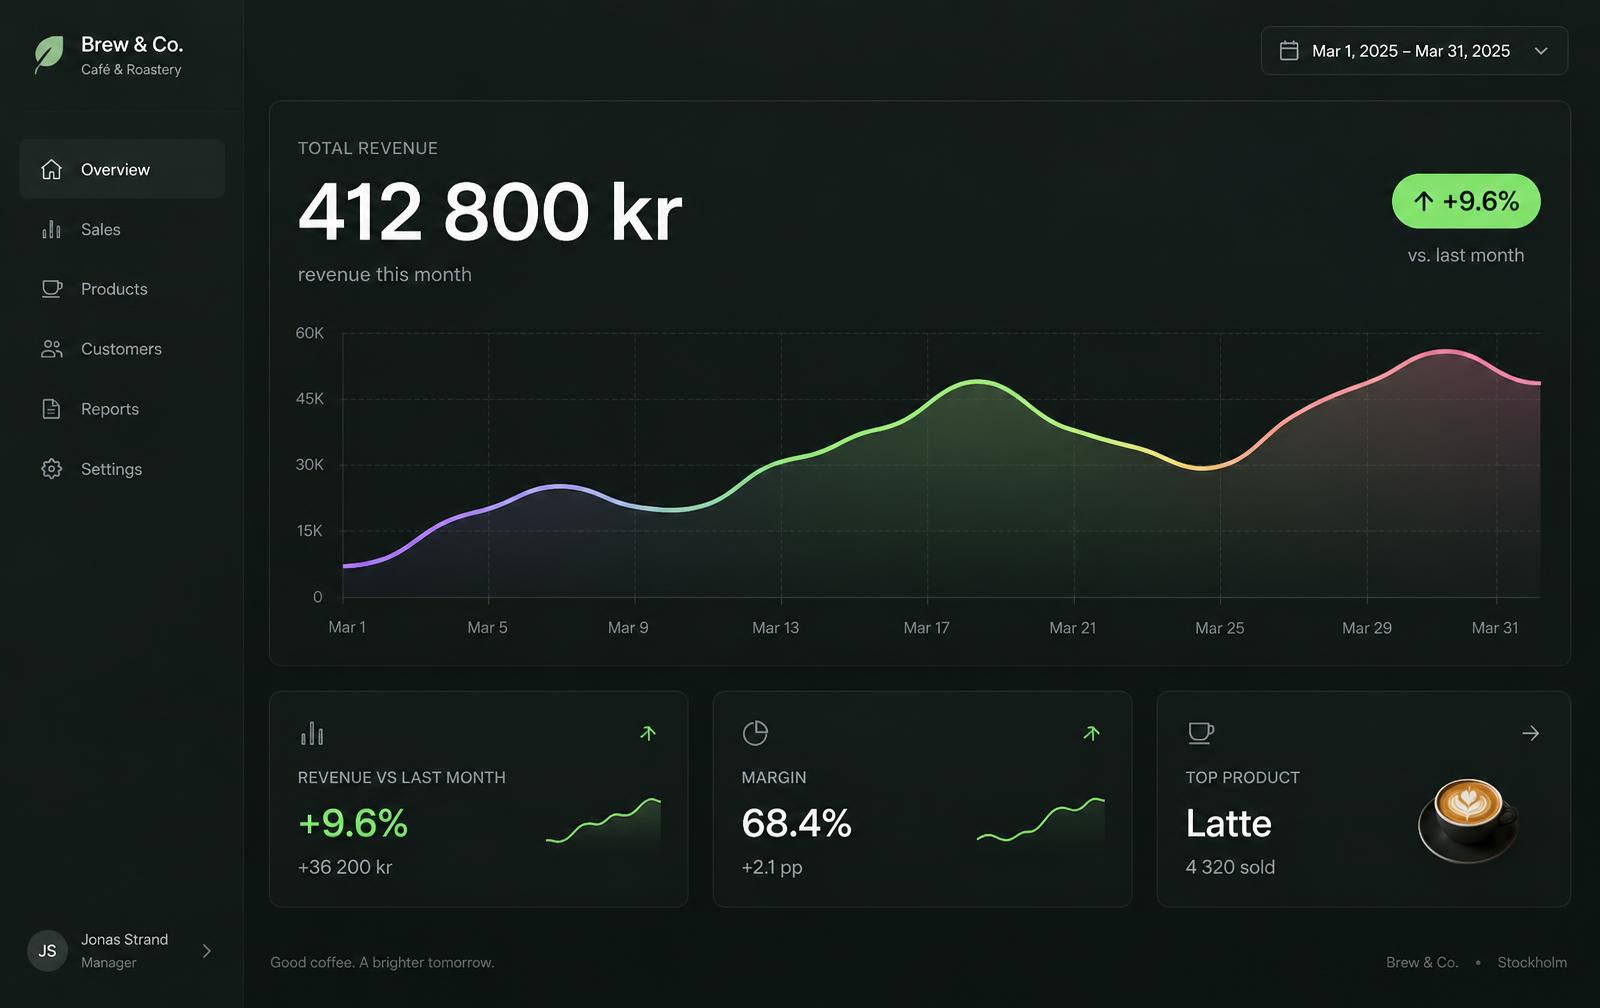 Financial overview
Revenue, margin and product performance in one always-current overview, with historical comparison built in. The same data becomes a finished weekly, monthly, yearly or sustainability report whenever you need one, ready to download or share.
Built for owners and managers. The same figures, explained at the level each of them needs.
THE PROBLEM
The numbers exist. Somebody still has to build them by hand.
Sales, costs and performance sit in separate systems that were never designed to talk to each other. Understanding the month means exporting, pasting and reconciling it yourself, usually late in the evening, usually more than once.
Data trapped in separate systems
Financial and performance figures live in tools that do not talk. Hours of manual work to understand one month.
Reports built by hand, every time
Weekly, monthly and yearly reports start from an empty sheet, again and again.
No comparison without rebuilding it
Year-over-year and historical context exist, but only if somebody assembles them manually first.
And the reporting never stops.
Every week, month and year starts from scratch. Comparisons with last year get rebuilt by hand. EU sustainability and ESG requirements keep expanding, and there is no simple way to produce them. Meanwhile decisions on pricing and priorities are made before the picture is finished.
ESG and sustainability requirements
EU reporting demands keep growing, with no simple way to produce the documentation.
Decisions without the full picture
Pricing, performance and priorities get decided before the numbers are finished.
Time taken from the floor
Every hour spent reconciling figures is an hour not spent with guests, team and quality.
“I worked behind the counter for two years. Then I spent a week weighing every product that was thrown away at a busy Stockholm café. The distance between what was reported and what was actually happening is the reason Kai exists.”
THE SOLUTION
One financial intelligence layer above everything you already run.
Kai reads the sales and financial data you already have, keeps your history in one place, and turns it into a current picture and finished reports. Nothing on your side changes.
Your existing systems stay exactly as they are.
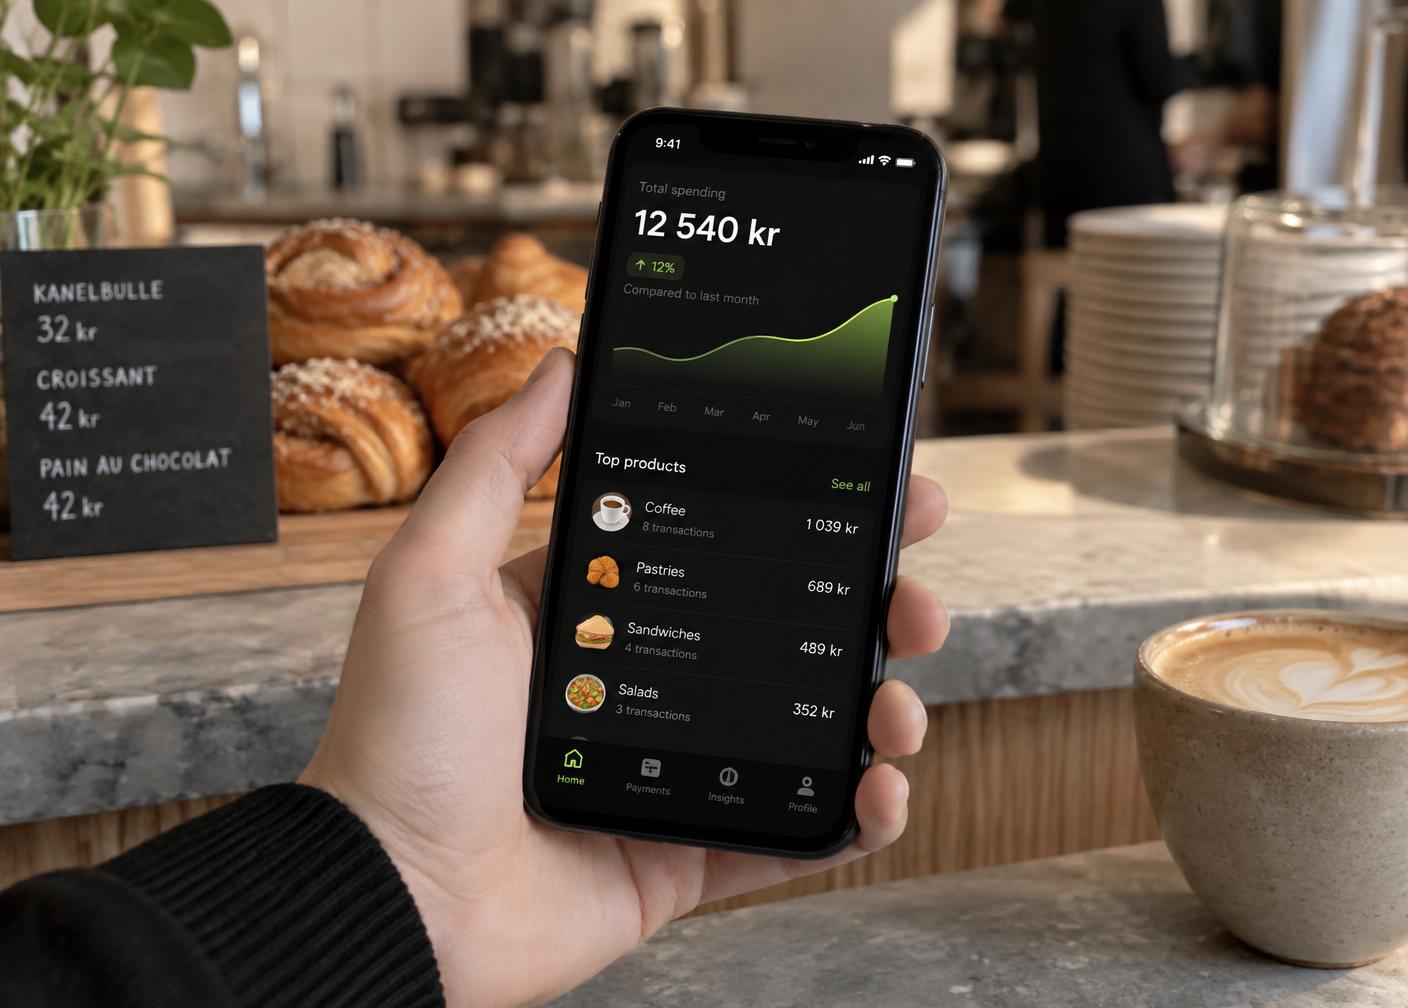

Financial overview agent
Live revenue, margin and product performance. Always current, never assembled by hand.

Sales analytics agent
Product performance, trends by period and pricing suggestions from your own figures.

Historical comparison agent
Month-over-month and year-over-year, calculated automatically for any period you pick.

Sustainability and ESG reporting agent
Compliance and sustainability documentation generated as a byproduct, not a separate task.

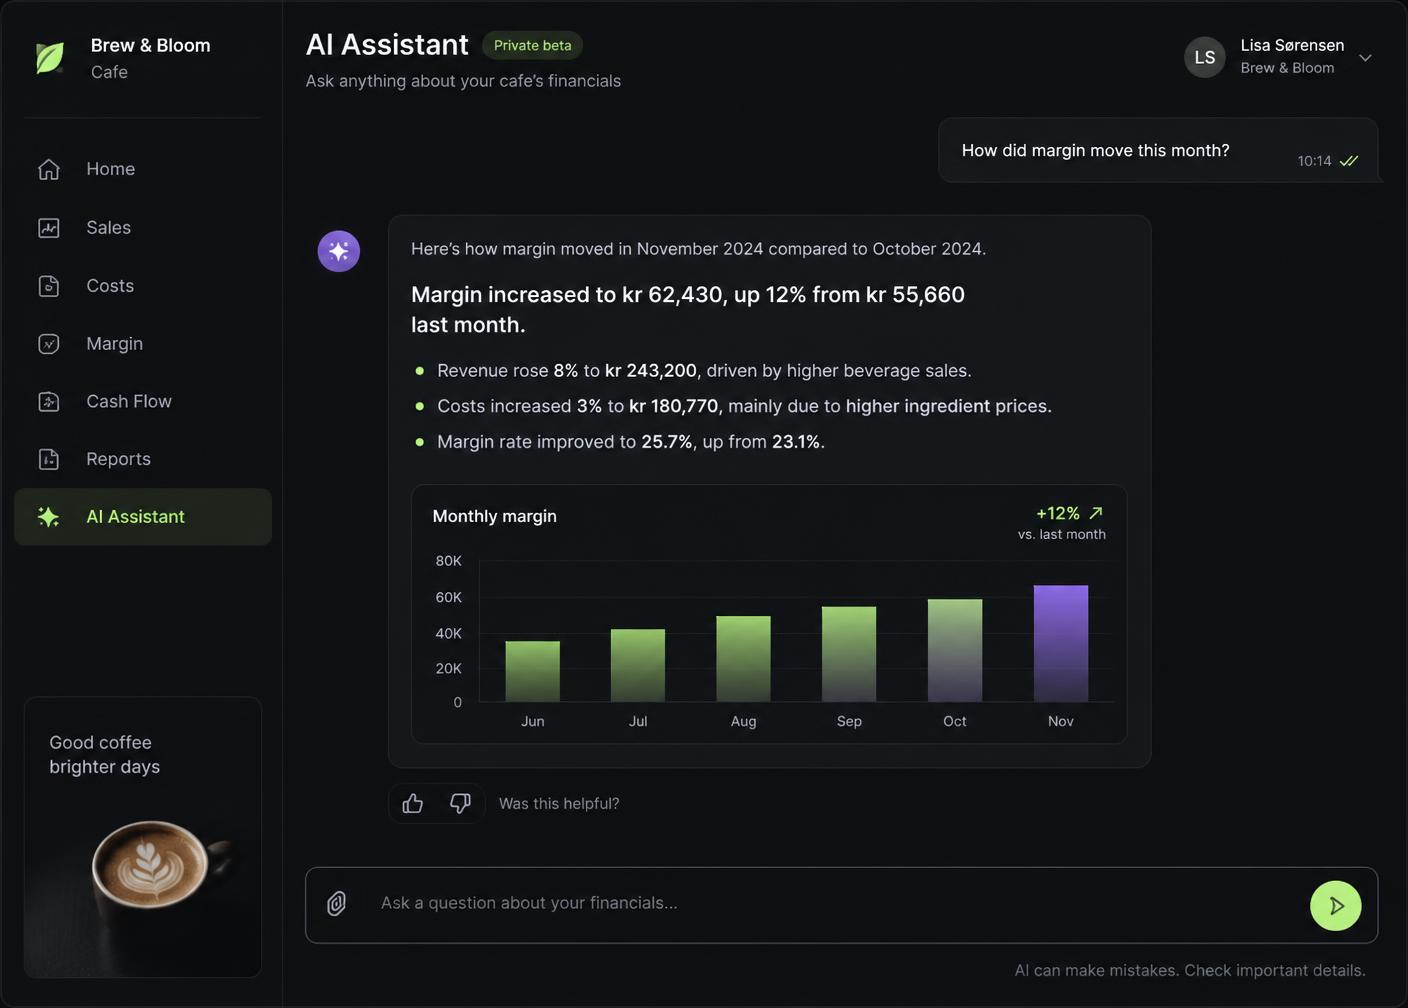
AI assistant, always available
Ask any question about your numbers in plain language and get an answer from your real data.

Automated report generation
Weekly, monthly, yearly and sustainability reports produced on their own, with charts and PDF.
WHAT CHANGES
Four things change once the numbers build themselves.
Hours become minutes
Reports that took an evening are generated automatically, with charts and comparisons already in place.
Numbers you can trust
One clear, always-current financial picture, built from your own records. No manual reconciliation.
Never caught off guard
Walk into any meeting with ownership already knowing revenue, margin and what moved, and why.
Compliance takes care of itself
ESG and sustainability documentation is produced automatically as the system runs, not written from scratch.
THE HIDDEN PROBLEM
Results
This is what happens when nobody has a clear, current picture of their own numbers. I ran an independent study in a busy Stockholm café, physically weighing every product that did not sell and comparing it with what the systems reported. Food waste was simply the most visible symptom.
0%
of fresh baked products measured as waste in daily weighing, against 3.5% reported by the systems in use
0%
of weekly revenue identified as recoverable through better handling of food waste alone
0
national café chain in Sweden where the findings informed how food saving is handled
“The reported figure was 3.5%. Measured on a scale, the real number was closer to 40%. Nobody was doing anything wrong. The system was simply not there to show it"
HOW IT WORKS
Up and running in one week. The results will speak for themselves
- 01
Short conversation
What matters most to your operation, and what systems you run today.
- 02
Kai connects
We bring in your existing sales and financial data. Nothing changes on your side.
- 03
Everything becomes visible
Revenue, margin, product performance and historical comparison in one place from day one.
- 04
You see your own numbers
After one week: your real financial picture and your first report, generated automatically.
QUESTIONS
Everything cafés ask before a pilot.
Every pilot application and email is answered within one business day, usually the same day. Setup starts within a week of the first call.
Apply for a free pilot.
I handle every pilot personally, so only a small number of Stockholm cafés can run at a time. Pilot cafés lock in founding pricing when the product moves beyond the free pilot phase.
At worst, you end up exactly where you are today.
THE FOUNDER
Built by someone who worked behind the counter.
Hannibal Toric
Founder, Kai
I spent two years as a barista in Stockholm. Every café I worked in was run by capable people working with disconnected systems and incomplete numbers. So I measured the problem properly, and then built the layer that solves it.
- Two years of barista experience in Stockholm specialty cafés
- Independent food waste study measuring actual waste against reported figures
- Findings used to inform food saving practice at a national café chain in Sweden
- Kai pilot programme currently running with Stockholm cafés
Ready to see your own numbers?
Email us at hannibal@kaisolutions.se